
When Correlations Go to 1
By Sardis Group
This week, two charts really caught our attention. The first from Bloomberg tells an interesting story about volatility:
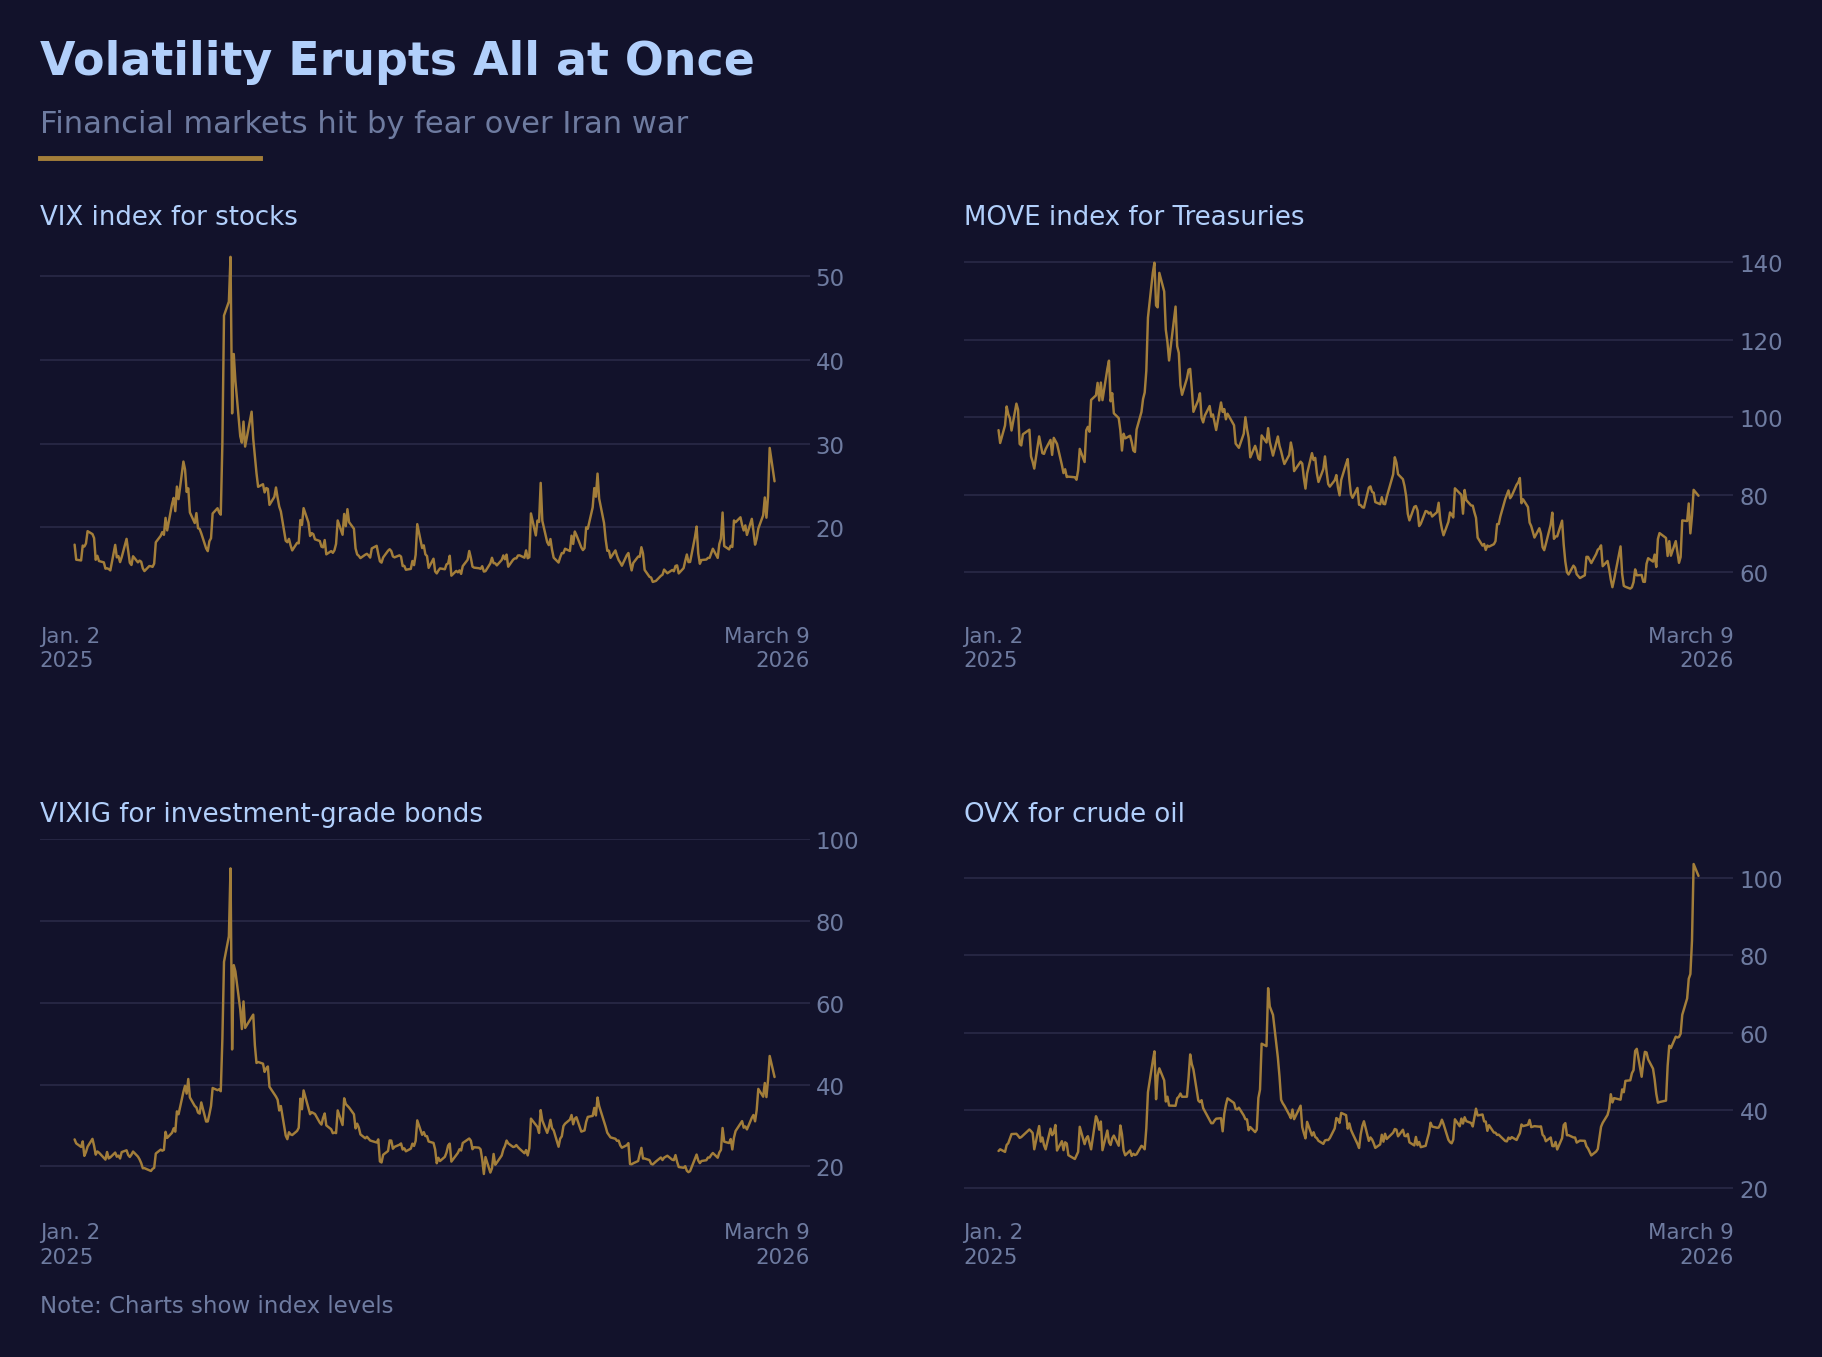
Similar to prior volatility storms, portfolio design can break down as correlations turn to 1. Equities and fixed income have all had negative total returns1 from the day before the war began (2/27/26) through last night. For all the noise, fundamentals haven’t shifted. In fact, as a result of the One Big, Beautiful Bill Act, tax refunds this year should be the largest in recent history as you can see in the chart below from Morgan Stanley.
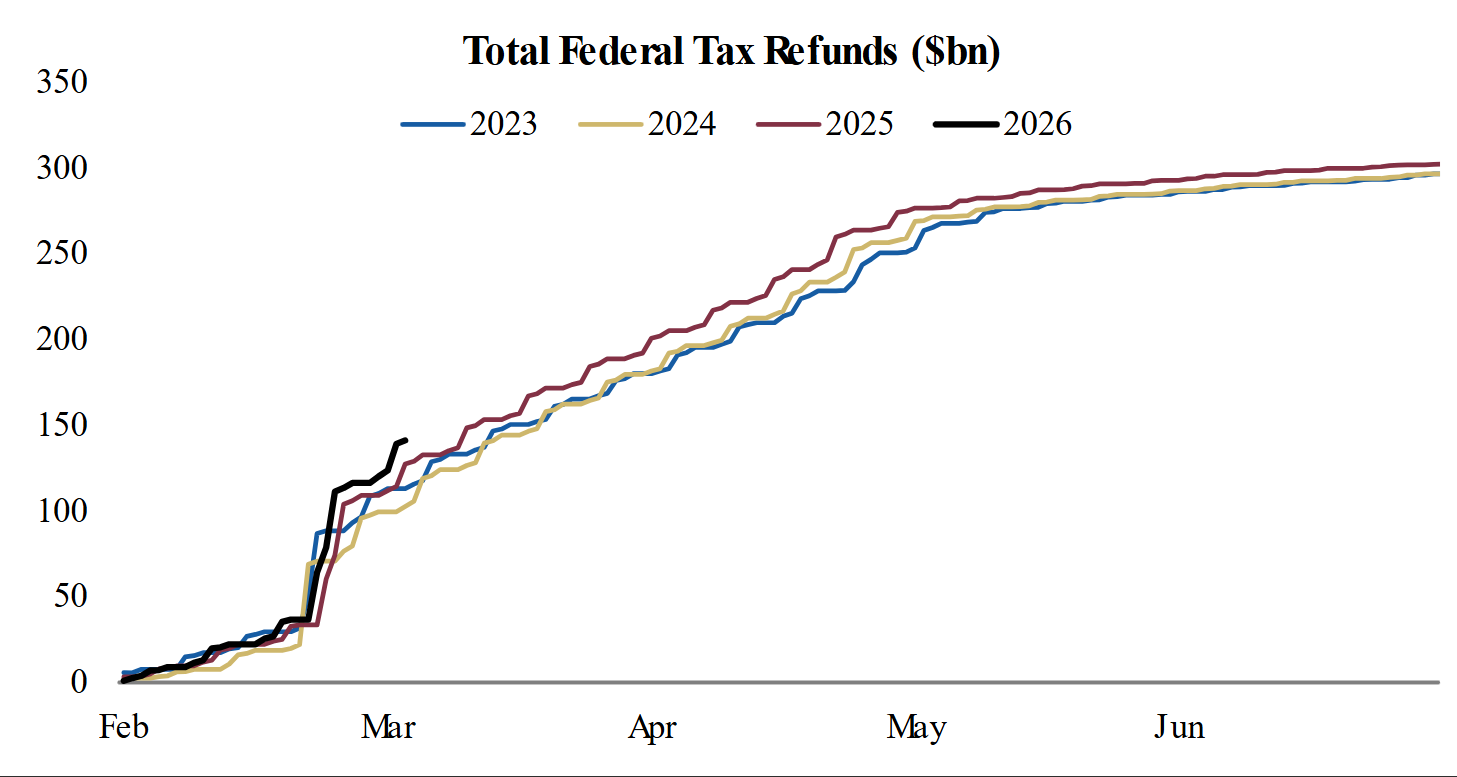
Should the shift higher in rates and the spike in oil prices hold for several months, that would reverse some of the gains in affordability. In the interim, the US Consumer is getting more money back this tax season.
If you would like to discuss these charts or anything else with respect to the market, please do not hesitate to reach out. As always, we appreciate your partnership.
- SPX for equities (-1.37%); Bloomberg US Agg Total Return Index (-0.96%); Bloomberg US Corporate High Yield Total Return Index (-0.22%).
Want to discuss?
Reach out to the team for additional commentary or to be added to our distribution list.
Contact Us Back to Insights