
State of U.S. Commercial Real Estate
By Sardis Group
Impact of Zero-Bound Rate Policy on Commercial Real Estate
The U.S. commercial real estate (CRE) market has not repriced to the current interest-rate regime that started in 2022, and the rapid rise in rates since March 2026 has only exacerbated the problem. The result is near-record CMBS distress concentrated in loans that are secured by fundamentally sound cash-flowing properties but unable to refinance at today's rates and valuations.
- Cap rates have not kept up with the rapid rise in nominal interest rates. The 10-year Treasury yield rose 437 bps from December 2020 to September 2026, while the average all-property cap rate kept falling until July 2022 and has since increased only 133 bps. The cap rate spread relative to the 10-year Treasury is 145 bps, versus the 20-year average of 365 bps.
- Despite headline inflation concerns, inflation is not the problem. Of the 111 bps rise in the 10-year Treasury since December 2025, nearly 101 bps came from rising real yields; inflation breakevens only increased 10 bps.
- Many loans originated in the zero-bound era are stranded. A property purchased in 2021 at a 4.5% cap rate with 65% LTV at a 3.5% coupon needs roughly $10 of new equity per $100 of original purchase price to refinance at maturity in 2026, despite cumulative NOI growth of ~16%.1
- Multifamily properties are under tremendous pressure. Apartment cap rates (5.9%) are only 64 bps over the 10-year Treasury yield and below current apartment mortgage rates.
- Distress is at or near historic highs. The overall CMBS delinquency rate reached 8.0% in September 2026, which is the highest since November 2020; including performing loans past maturity, it is 9.7%. Loans that are specially serviced now total 11.5%, the highest since February 2013.
- Distress is not limited to Office properties. While Office delinquency rates stand at 12.2%, Multifamily delinquency rates have risen to 8.0% from 6.6% over the last 12 months, and apartment prices (RCA CPPI) are 22.8% below their July 2022 peak and still falling.
- Triple-A SASB bonds are not safe from downgrades and losses. Nearly 18% of SASB bonds have been downgraded, and losses have reached the senior-most class in five deals.
- The recovery in refinancing activity is fragile. Thirty-nine percent of 2026 SASB maturities were paid by maturity, up from 9% in 2023, but extensions remain elevated as borrowers maintain a free option on lower rates.
State of Commercial Real Estate by Property Type
Office is structurally impaired, while Multifamily and Industrial property fundamentals remain sound but are softening, and NOI growth has not been able to keep up with the higher cost of capital.
- Office – The national vacancy rate is 21.2% with negative net absorption for most quarters since 2022. Nominal effective rents, while up 2.9% since 2019, have declined in real terms. CBD Office prices are 9.4% higher YoY, but are rebounding from deeply depressed levels. Trophy assets and select markets such as Manhattan have performed significantly better than national CBD Office prices.
- Multifamily – Rents are 26% higher than in 2019, but growth has stalled at 0.7% YoY as record deliveries post-COVID were absorbed. Vacancy has increased to 6.8% from 4.9% since mid-2022. Apartment values have posted annual declines for 10 consecutive months.
- Industrial – Prices are up YoY. Industrial CMBS delinquencies total 1.1%. Price growth is flat-lining and vacancies are increasing.
- Retail – Stable vacancy rates after a decade of limited supply; distress is concentrated in regional malls.
Fundamentals are softening in a higher cap rate environment
| Property type | Vacancy 2Q26 | Vacancy 2Q22 | Eff. rent vs. 4Q19 | Rent growth, YoY | Avg. cap rate, Sep 2026 |
|---|---|---|---|---|---|
| Office | 21.2% | 18.4% | +2.9% | +0.8% | 7.48% |
| Multifamily | 6.8% | 4.9% | +26.4% | +0.7% | 5.92% |
| Retail | 10.5% | 10.4% | +3.0% | +1.0% | 6.99% |
| Industrial | 8.7% | 5.2% | +48.8% | +1.4% | 6.55% |
Source: Moody's REIS (vacancy, rents); national average cap rates via Bloomberg.
Performance Post-2022 Peak
National property prices are 10% below their 2022 peak and have barely recovered. Apartments and CBD Office properties are down 23% and 44%, respectively.
Change from post-2022 peak
| Index | Sector | Peak date | Peak-to-trough | Peak-to-current | Latest |
|---|---|---|---|---|---|
| RCA CPPI | All property | Jul 2022 | –12.0% | –10.3% | Aug 2026 |
| RCA CPPI | Apartment | Jul 2022 | –22.8% | –22.8% (new low) | Aug 2026 |
| RCA CPPI | Office – CBD | Mar 2022 | –50.0% | –44.4% | Aug 2026 |
| RCA CPPI | Office – suburban | Jul 2022 | –18.8% | –12.7% | Aug 2026 |
| RCA CPPI | Retail | Jul 2022 | –10.0% | –6.1% | Aug 2026 |
| RCA CPPI | Industrial | Sep 2025 | –1.0% | 0.0% (at peak) | Aug 2026 |
Source: MSCI RCA CPPI via Bloomberg. Peak = highest reading since 2022; trough = lowest reading after that peak.
Cheap Debt, Low Cap Rates and the Maturity Wall
Many of the distressed loans were underwritten in the lowest interest rate environment in modern history and at peak CRE valuations. Between 2020 and 2021 the 10-year Treasury averaged ~1%, with real yields of ~-1%. Strong demand from tenants for Multifamily and Industrial properties pushed cap rates to record lows: apartment cap rates fell to 4.4% in 2022 and Industrial cap rates fell to 5.1%.
Record low cap rates inflated valuations and loan sizes. A 65% LTV on a 4.5% cap rate is approximately an 87% LTV on a 6.0% cap rate.
Low mortgage rates allowed excessive leverage. At a 3.5% mortgage rate, a 65% LTV loan on a 4.5% cap rate provides 2x debt service coverage (interest-only). The same loan at a 6.5% mortgage rate covers debt service 1.07x (original NOI), which is below what lenders will refinance.
Rate shock depressed acquisition activity. Conduit CMBS acquisition activity is on pace to finish 2026 at 43% below 2022 levels (Trepp).2 Refinancing is driving the lending rebound, which is limiting price discovery as there is a valuation gulf between buyers and sellers.
Lenders and special servicers are choosing to modify and extend loans. Since many of the underwater properties are performing, lenders and special servicers are incentivized to modify and extend loans rather than liquidate into a distressed environment. Post-maturity securitized loans still outstanding total $163 billion as of 2Q26 (Newmark/Trepp).
Banks and securitized lenders are most exposed to refinancing risk given the size of the maturity wall. Stated maturities overstate balloon maturities because many loans carry contractual extension options.
CRE maturity wall concentrated in Banks and CMBS
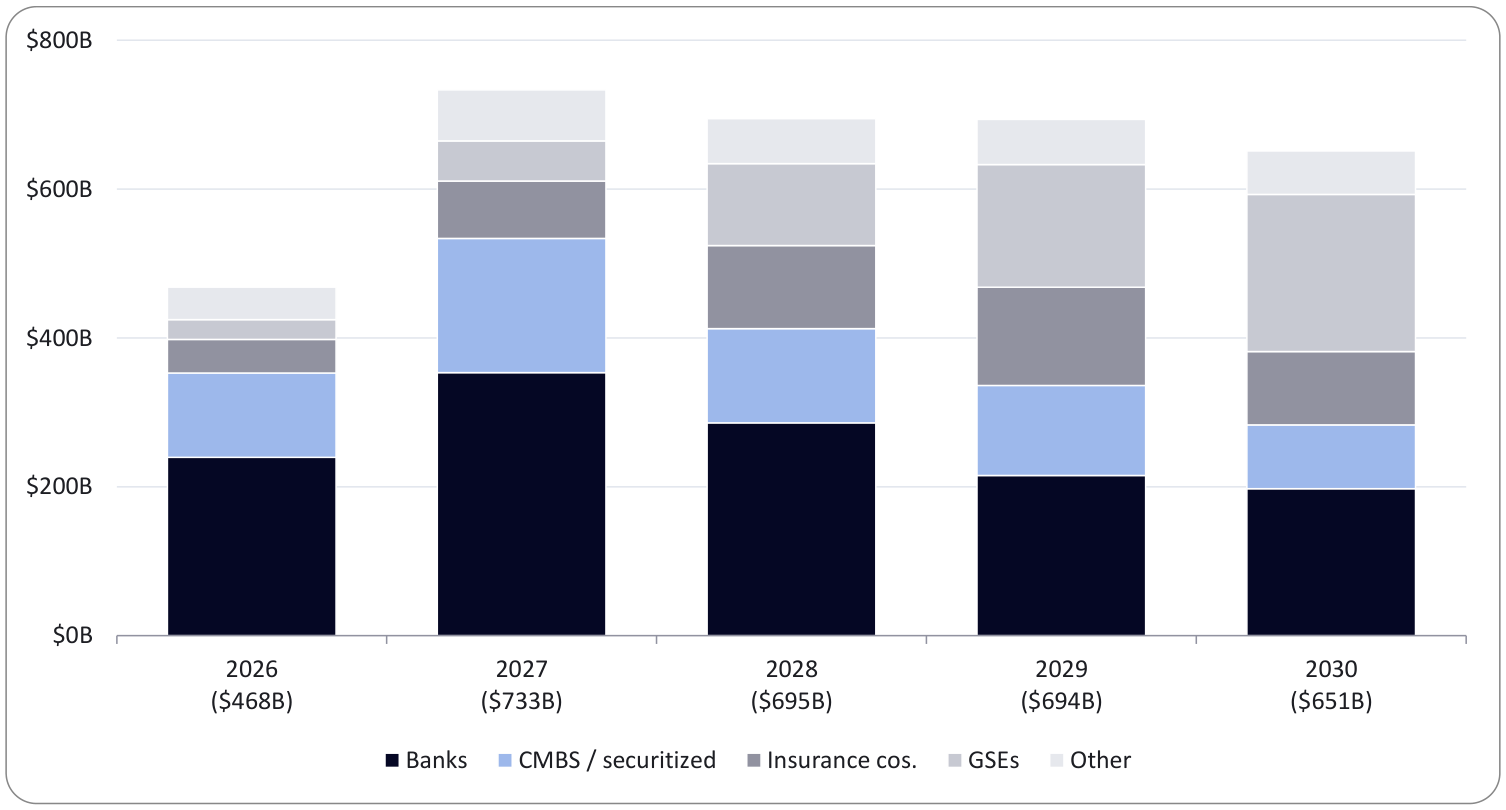
Source: Trepp, Inside the $5.1T CRE Debt Universe, 2Q26, Table 2 (Fed Z.1, FFIEC Call Reports, Trepp maturity distributions).
Bridging the Refinancing Gap
A property purchased in 2021 at a 4.5% cap rate loses value over a 5-year holding period unless NOI grows faster than cap rates rise; at today's ~6% market cap rate it needs nearly 6% annual NOI growth just to break even.
Illustrative example: $100 purchase in 2021 at a 4.5% cap rate ($4.50 NOI); $65 interest-only loan (65% LTV) at 3.5%; 5-year term. Original interest coverage: 1.98x.
Change in property value (5-year holding period)
| Exit cap rate ↓ / NOI growth → | 0% | 1% | 2% | 3% | 4% | 5% |
|---|---|---|---|---|---|---|
| 4.50% (purchase cap) | 0.0% | +5.1% | +10.4% | +15.9% | +21.7% | +27.6% |
| 5.00% | –10.0% | –5.4% | –0.6% | +4.3% | +9.5% | +14.9% |
| 5.50% | –18.2% | –14.0% | –9.7% | –5.2% | –0.5% | +4.4% |
| 6.00% | –25.0% | –21.2% | –17.2% | –13.1% | –8.8% | –4.3% |
| 6.50% | –30.8% | –27.2% | –23.6% | –19.7% | –15.8% | –11.6% |
| 7.00% | –35.7% | –32.4% | –29.0% | –25.5% | –21.8% | –18.0% |
| Breakeven exit cap | 4.50% | 4.73% | 4.97% | 5.22% | 5.47% | 5.74% |
Exit value = Year-5 NOI ÷ exit cap rate. Excludes capex, leasing and transaction costs. Bold cell = base case.
New equity required to refinance the $65 loan in year 5
| Exit cap rate ↓ / NOI growth → | 0% | 1% | 2% | 3% | 4% | 5% |
|---|---|---|---|---|---|---|
| 4.50% | $17.5 | $15.1 | $12.6 | $10.0 | $7.3 | $4.4 |
| 5.00% | $17.5 | $15.1 | $12.6 | $10.0 | $7.3 | $4.4 |
| 5.50% | $17.5 | $15.1 | $12.6 | $10.0 | $7.3 | $4.4 |
| 6.00% | $17.5 | $15.1 | $12.6 | $10.0 | $7.3 | $4.4 |
| 6.50% | $20.0 | $17.7 | $15.3 | $12.8 | $10.3 | $7.6 |
| 7.00% | $23.2 | $21.1 | $18.9 | $16.6 | $14.2 | $11.7 |
New loan = lesser of 65% LTV or 1.25x DSCR at a 6.5% rate with 30-year amortization. Equity required = $65 existing loan – new loan. Rows 4.50%–6.00%: DSCR constraint; rows 6.50%–7.00%: LTV constraint.
Hypothetical Recapitalization Details. At a 6.0% exit cap and 3% NOI growth (in bold), the property is worth $86.95, 13% below cost, despite 16% NOI growth. The new loan is capped at $55.00 by debt service coverage, so $10 of new equity is required, 29% of the initial $35 equity check.
Office and Retail cash-in refinancings in conduit CMBS required equity of ~15% of the debt stack in 2026 (Trepp). Securitized loans with debt yields below 7% (roughly DSCR under 1.25x) generally require added equity to refinance (Newmark).
Multifamily Disproportionately Impacted by Higher Rates
Currently, apartments have the lowest risk premium of any major property type. The national apartment cap rate is 5.9%, which is only 64 bps over the 10-year Treasury compared to an average of 286 bps over the last 20 years.
Apartment risk premium near 20-year lows as fundamentals moderate
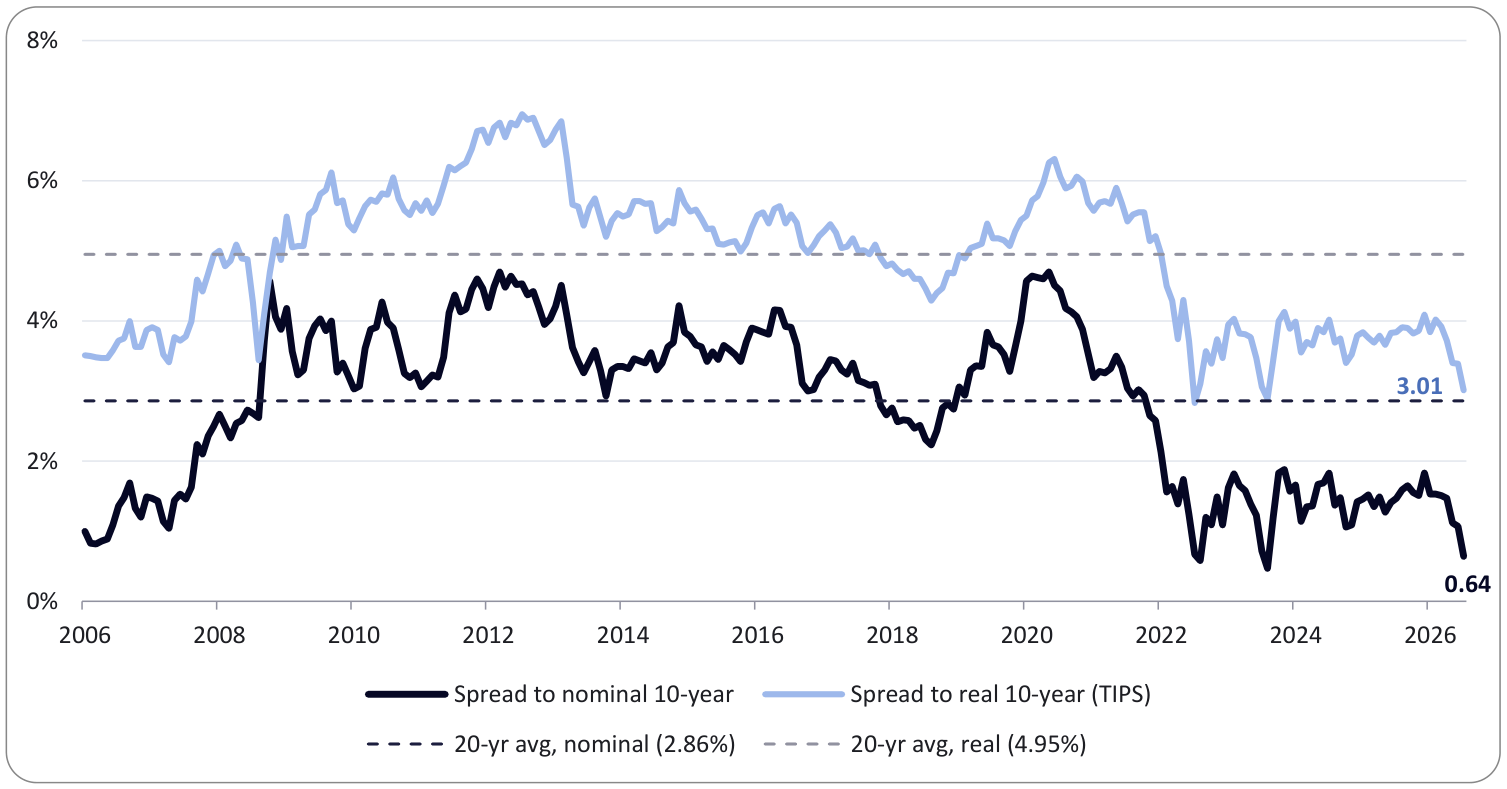
Source: Bloomberg (APRTNCAP national apartment cap rate; USGG10YR; USGGT10Y), month-end, Mar 2006–Sep 2026.
Negative leverage. Fixed-rate apartment mortgage rates averaged 5.3% in 2Q26 compared to an average 10-year Treasury rate of 4.4% (Newmark/RCA). With the 10-year at 5.28%, apartment borrowing costs are between 6% and 6.5%. Newly originated debt is no longer accretive to equity returns.
Cap rates have not kept up with nominal rates. Apartment cap rates have risen 147 bps since December 2021 (4.45% to 5.92%), while the 10-year Treasury rose 377 bps. The spread to real rates is 301 bps, versus a 495 bps average.
Multifamily was priced to perfection post-COVID. Apartment cap rates bottomed at 4.39% in July 2022, with real 10-year yields near zero. Effective rents rose 18% from 4Q19 to 2Q22.
Fundamentals have moderated. Rent growth slowed to 0.7% YoY and vacancy rates have risen to 6.8% from 4.9% in mid-2022. Completions declined to 38,000 units in 2Q26 from 97,000 a year earlier, which should provide a floor for rents as excess supply is absorbed.
Multifamily valuations
| Measure | Value | Comparison |
|---|---|---|
| Apartment cap rate (Sep 2026) | 5.92% | 4.39% low (Jul 2022) |
| Spread to nominal 10-year | 0.64% | 20-yr avg 2.86% |
| Spread to real 10-year (TIPS) | 3.01% | 20-yr avg 4.95% |
| RCA CPPI Apartment, peak-to-current | –22.8% | New low; 10 straight months of annual declines |
| Effective rent growth, YoY (2Q26) | +0.7% | +26.4% vs. 4Q19 |
| Vacancy (2Q26) | 6.8% | 4.9% in 2Q22 |
Source: Bloomberg (cap rates, Treasury yields, RCA CPPI, Moody's REIS); MSCI RCA CPPI, August 2026.
Signs of Distress Continue to Climb
The CMBS delinquency rate increased to 8.0% in September 2026, which is the highest since November 2020. The special servicing rate is at the highest level since February 2013 and totals 11.5%. Both have climbed over the last year, and are being driven by maturity defaults.
CMBS delinquency and special servicing rates
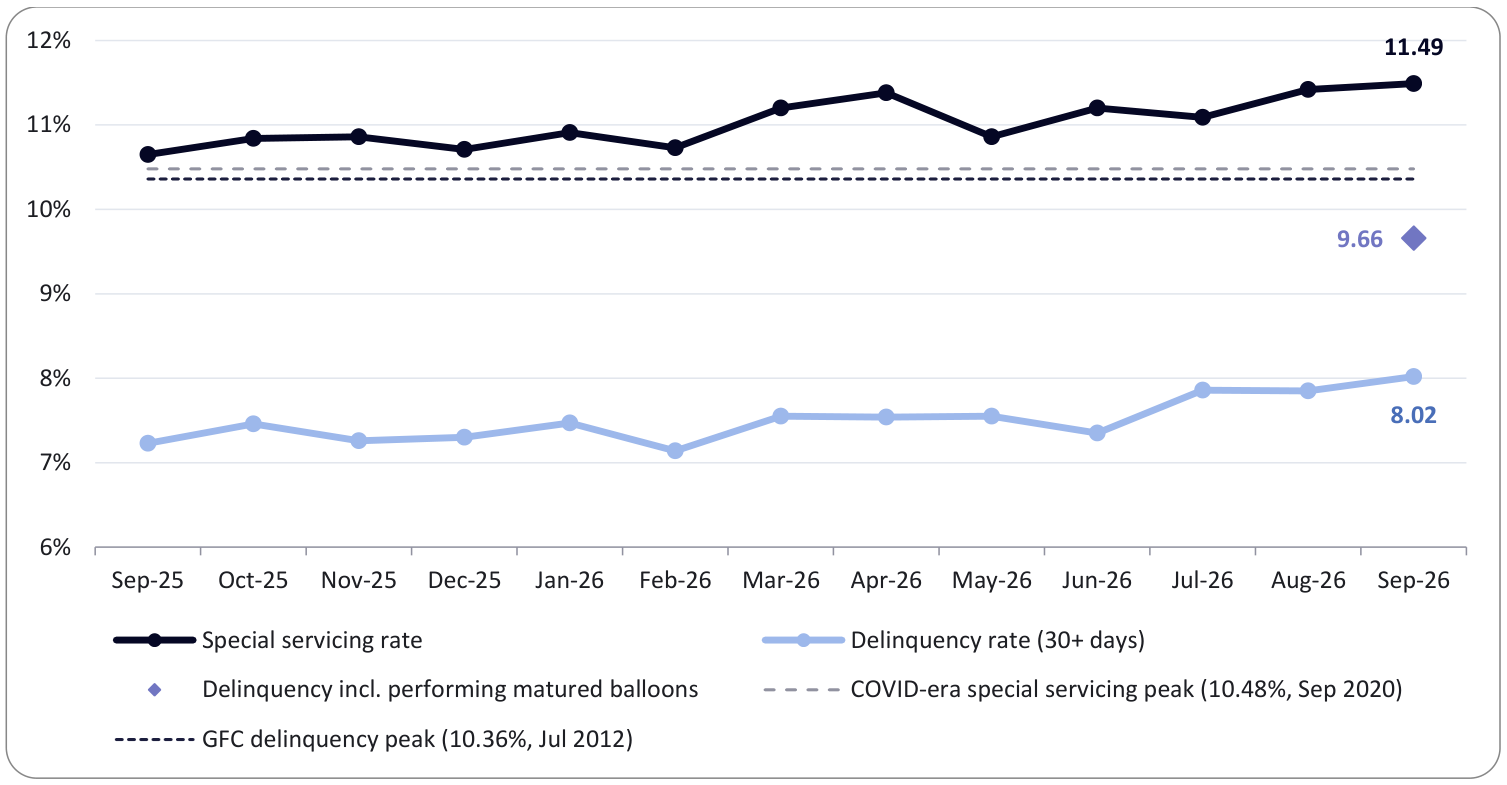
Source: Trepp CMBS Delinquency and Special Servicing Reports, Sep 2025–Sep 2026; GFC peak per Commercial Observer (Aug 2012); COVID special servicing peak per Trepp (Sep 2020).
CMBS delinquency and special servicing by property type
| Property type | Delinquency rate | Chg. vs. 12 mo. ago | Special servicing rate | Chg. vs. 12 mo. ago |
|---|---|---|---|---|
| Office | 12.16% | +103 bps | 16.85% | –6 bps |
| Retail | 6.58% | –18 bps | 13.84% | +190 bps |
| Mixed-use | — | — | 13.17% | +122 bps |
| Lodging | 6.18% | +37 bps | 8.95% | –96 bps |
| Multifamily | 8.04% | +145 bps | 8.54% | +34 bps |
| Industrial | 1.14% | +58 bps | 1.23% | +58 bps |
| All CMBS | 8.02% | +79 bps | 11.49% | +84 bps |
Source: Trepp CMBS Delinquency Report and CMBS Special Servicing Report, September 2026.
Triple-A SASB Not Immune to Downgrades and Realized Losses
Single-asset single-borrower (SASB) CMBS have experienced significant ratings downgrade pressure. Each SASB transaction is collateralized by a single loan or portfolio, and a downgrade often impacts the entire capital structure. Of the 5,614 SASB bonds in the SASB universe, 1,003 have been downgraded.
SASB downgrade percentage by property type
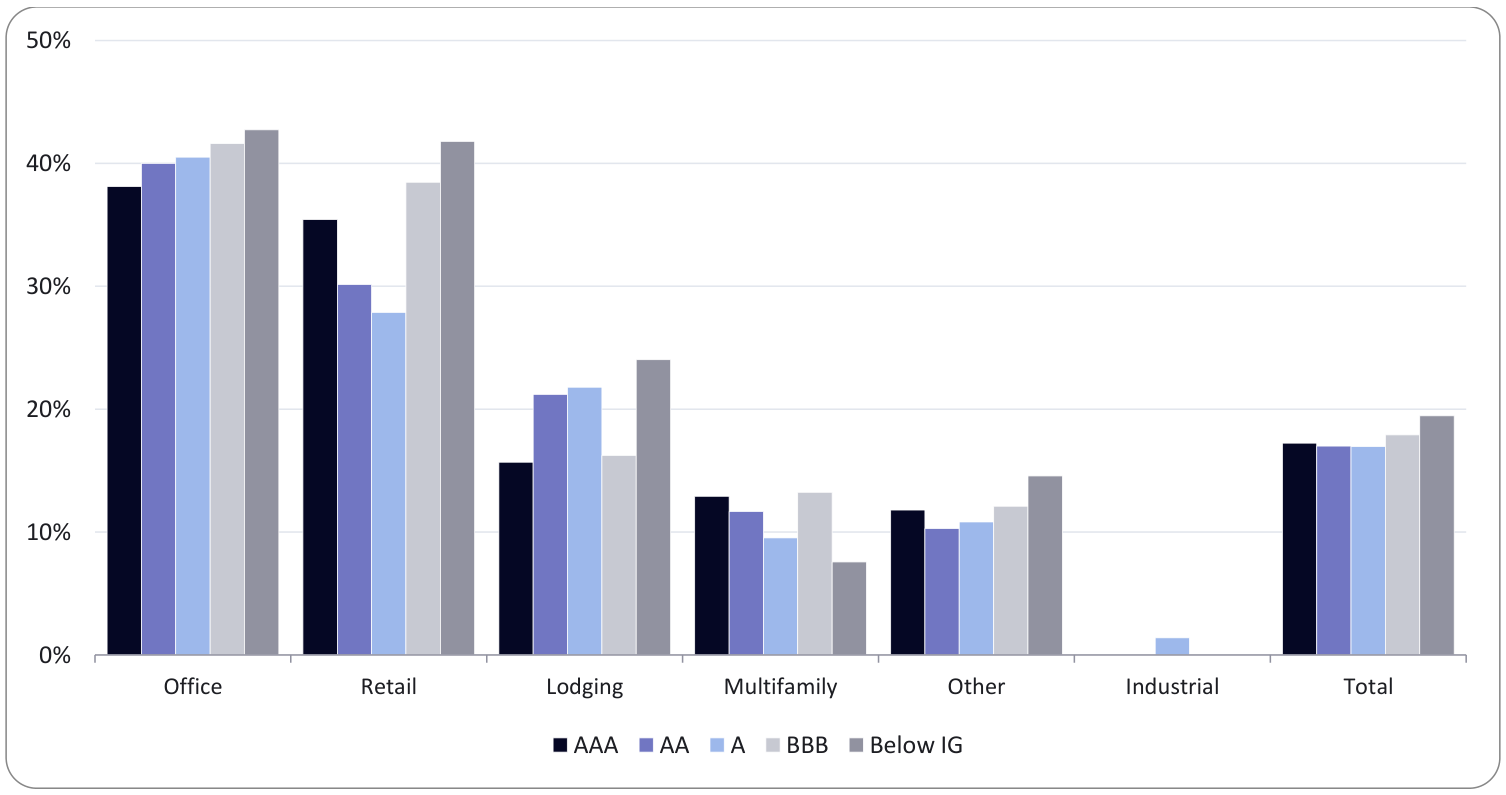
Source: Bloomberg, Trepp, Barclays Research.
Downgrades are severe. Of the 182 original AAA bonds downgraded, 27% are now below investment grade. Fifty-eight percent of investment-grade bonds that have been downgraded are now below investment grade.
SASB downgrade severity, by original rating
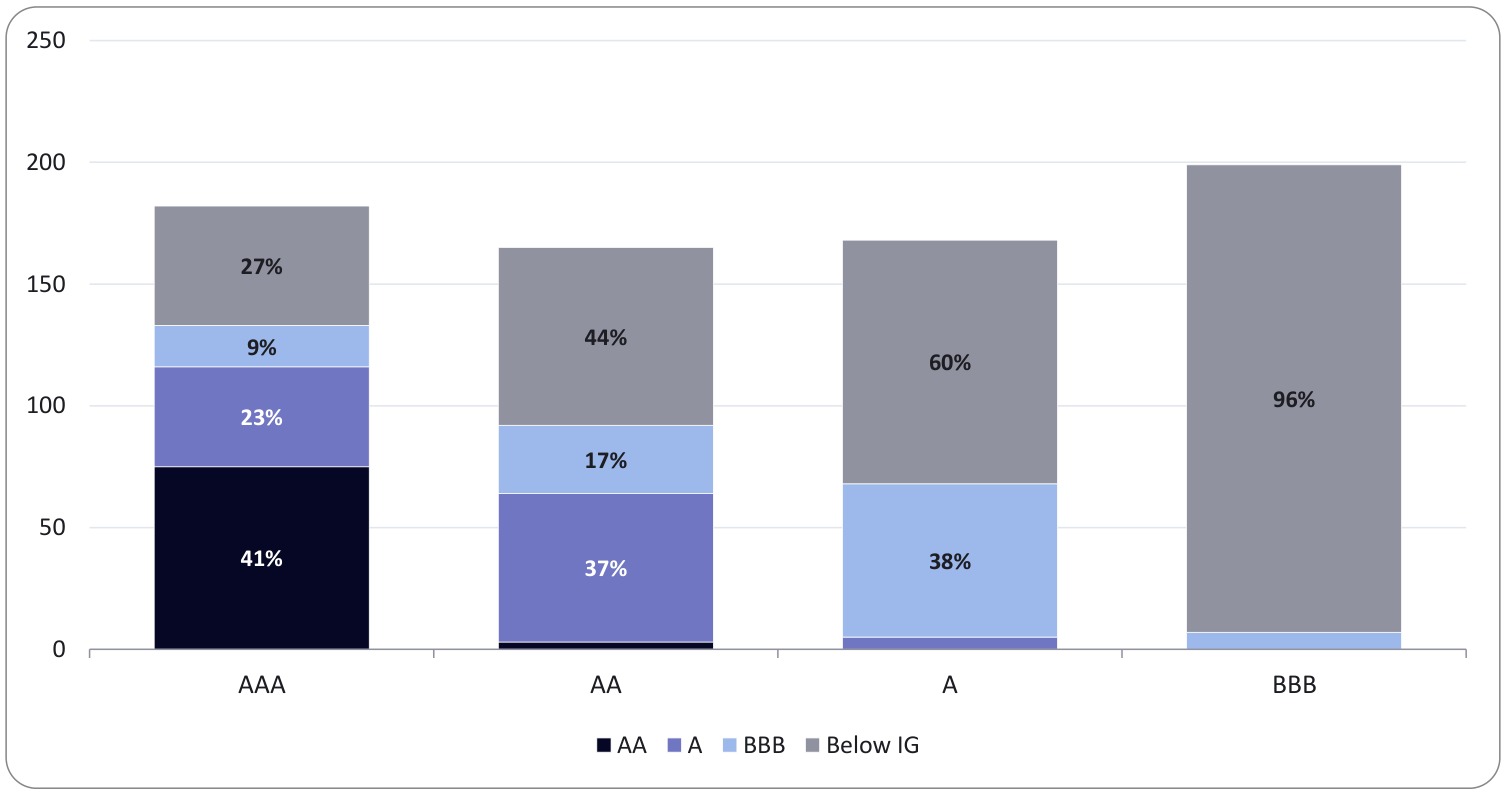
Source: Bloomberg, Trepp, Barclays Research. Bars show the number of downgraded bonds by original rating; labels show the share by current rating category.
Senior realized losses are limited in number but severe. Losses have reached the senior-most class in five deals, including two that were originally rated AAA (PCT 2016-PLSD and BWAY 2015-1740).
Realized SASB bond losses ($ million)
| Deal name | Vintage | Cutoff bal. | Curr. bal. | Deal loss | Loss pct. | Highest class with loss | Orig. rating (F / M / S / D / K) | Property type | Location |
|---|---|---|---|---|---|---|---|---|---|
| PCT 2016-PLSD | 2016 | 389 | 0 | 231 | 60 | A | - / Aaa / AAA / - / - | Retail | West Nyack, NY |
| BWAY 2015-1740 | 2015 | 308 | 0 | 191 | 62 | A | - / - / AAA / AAA / - | Office | New York, NY |
| CSMC 2020-522F | 2020 | 169 | 0 | 88 | 52 | A | - / - / - / - / - | Office | New York, NY |
| GSMS 2021-RNT2 | 2021 | 105 | 0 | 38 | 37 | A | - / - / - / - / - | Multifamily | San Francisco, CA |
| CF 2019-BOSS | 2019 | 112 | 0 | 71 | 64 | A-1 | - / - / - / - / - | Lodging | Brooklyn, NY |
| GCT 2021-GCT | 2021 | 350 | 0 | 161 | 46 | B | - / Aa3 / - / - / - | Office | Los Angeles, CA |
| GSCG 2019-600C | 2019 | 240 | 0 | 139 | 58 | B | - / - / AA- / - / - | Office | San Francisco, CA |
| JPMCC 2021-BOLT | 2021 | 233 | 0 | 69 | 30 | D | - / - / - / - / unrated | Office | Overland Park, KS |
| TRU 2016-TOYS | 2016 | 512 | 0 | 106 | 21 | E | - / - / BB- / - / - | Retail | Various |
| GSMS 2021-RENT | 2021 | 347 | 0 | 156 | 45 | E | - / - / - / - / BB- | Multifamily | San Francisco, CA |
| SRPT 2014-STAR | 2014 | 725 | 607 | 29 | 4 | F | - / - / B+ / - / - | Retail | Various |
| BBCMS 2019-BWAY | 2019 | 350 | 341 | 4 | 1 | HRR | B+ / - / - / - / - | Office | New York, NY |
| GSMS 2021-RSMZ | 2021 | 113 | 0 | 113 | 100 | MZ | - / - / - / - / - | Office | Arlington, VA |
Deals with realized losses greater than 1% of the balance at issuance. Source: Trepp, Barclays Research.
Refinancing Green Shoots Are at Risk
SASB maturity performance has improved despite higher rates. A total of 39% of 2026 SASB maturities have been paid by maturity, up from 27% in 2025, 16% in 2024 and 9% in 2023. Extensions have declined to 34% of the 2026 maturing balance from 82% in 2023. The 2026 figures include 4Q26 loans that have not yet reached maturity; 20% of the 2026 balance is still outstanding.
Maturity performance
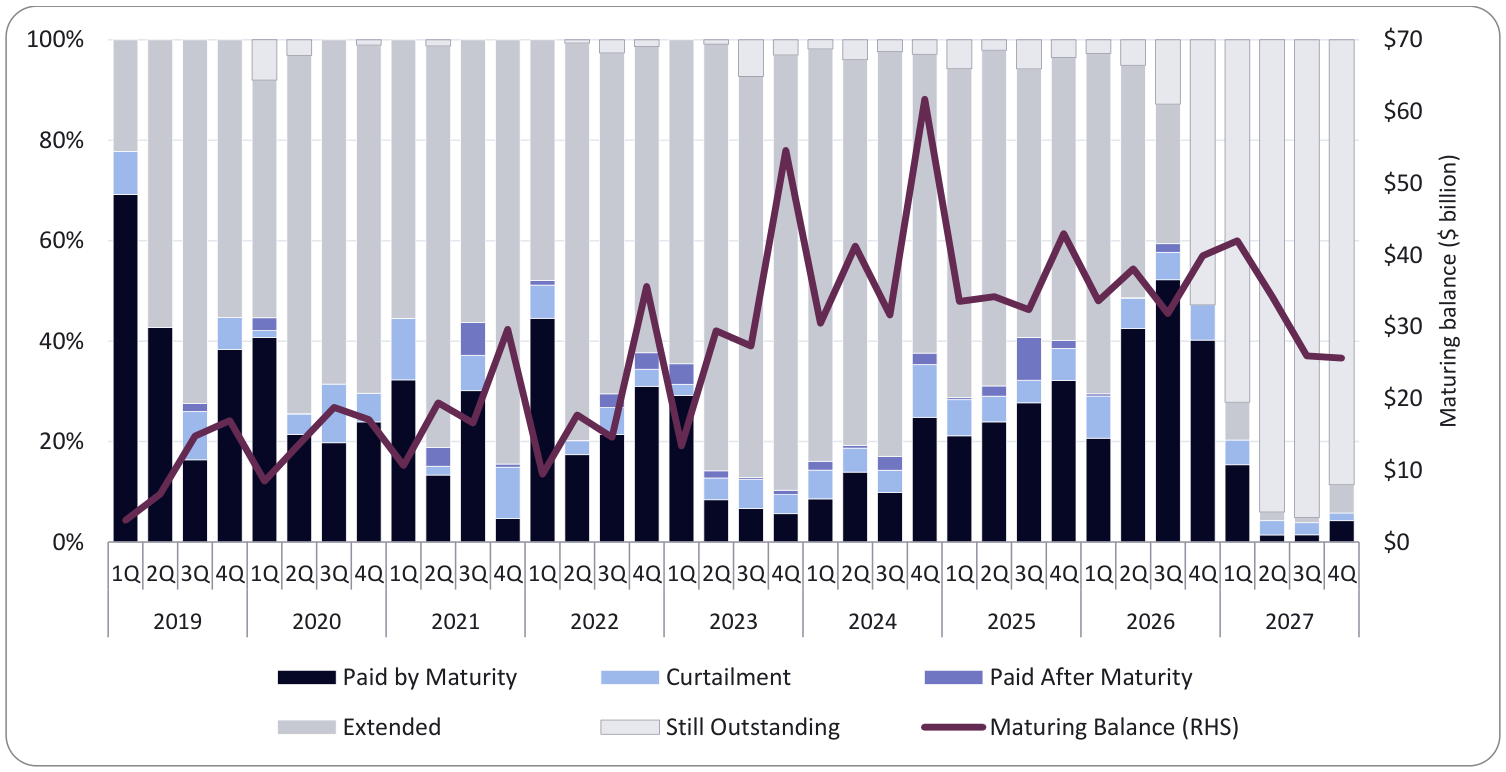
Source: Trepp, Barclays Research. Share of maturing balance by outcome (LHS); maturing balance (RHS).
Payoff rates are improving. Thirty percent of 1Q26 maturities repaid, rising to 49% in 2Q26 and 59% in 3Q26.
Extensions have been the most likely outcome. Between 2019 and 2025, 59% to 82% of the SASB balance maturing each year was extended.
SASB maturities by outcome, 2023-2027
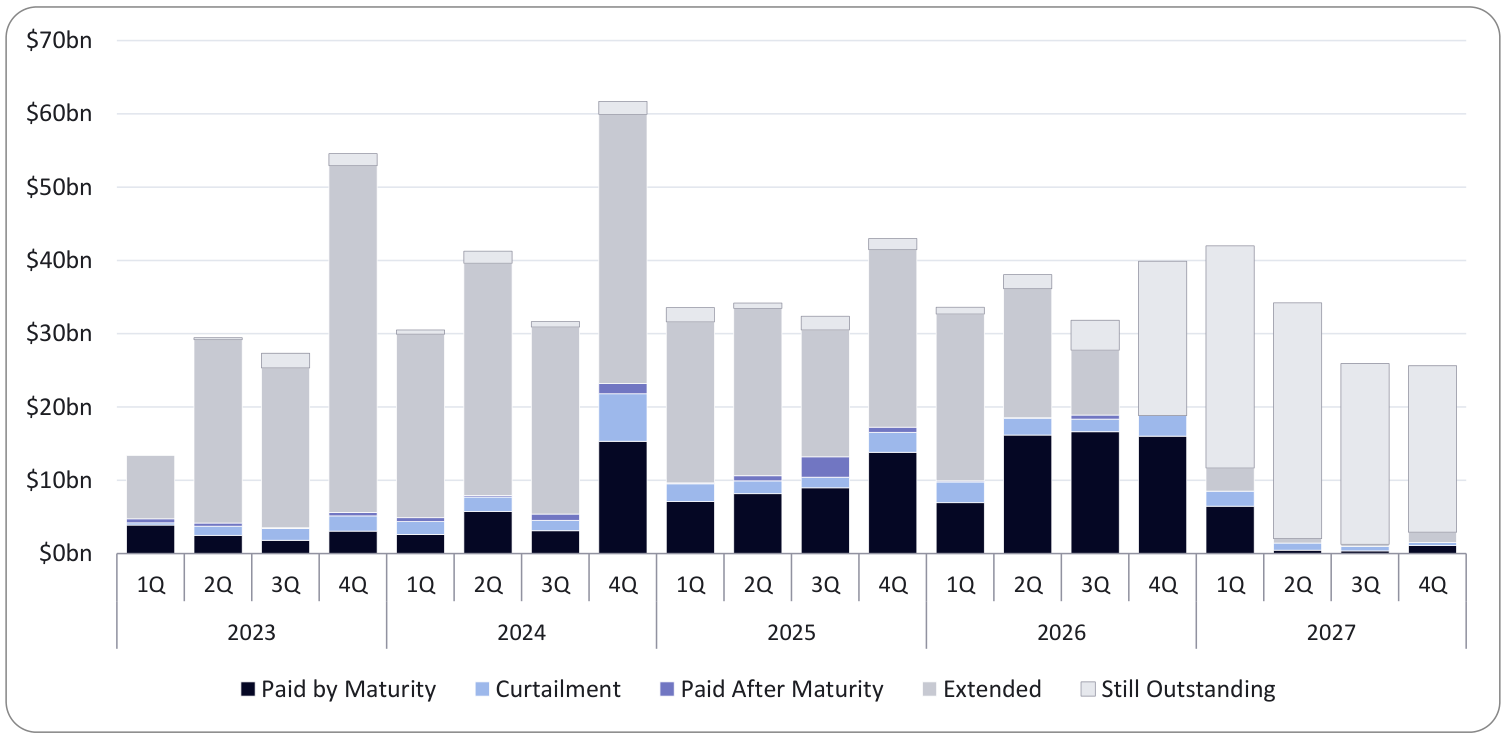
Source: Trepp, Barclays Research.
SASB maturity outcomes
| Year | Maturing balance | Paid by maturity | Curtailment | Paid after maturity | Extended | Still outstanding |
|---|---|---|---|---|---|---|
| 2023 | $124.7 billion | 9% | 4% | 1% | 82% | 3% |
| 2024 | $165.1 billion | 16% | 7% | 2% | 72% | 3% |
| 2025 | $143.1 billion | 27% | 6% | 3% | 60% | 4% |
| 2026 | $143.4 billion | 39% | 7% | 1% | 34% | 20% |
Source: Trepp, Barclays Research. 2026 still outstanding includes 4Q26 loans that have not yet reached maturity.
Despite the positive payoff trends, interest rate volatility and the prospect of a higher fed funds rate put the recovery at risk.
Extend, Pretend and Hoping For Better Times
Delinquency and special servicing are likely to remain elevated until market participants capitulate. Transaction volumes and price discovery normalization are required for a recovery, but are unlikely with real yields at 3%.
Owners maintain a free option. Extension costs for owners of overlevered assets are modest relative to the cost of a recapitalization. Borrowers keep the upside if rates and cap rates fall. Lenders have been amenable to extensions because a forced sale would lock in losses for them as well. At this point, loss recognition has been delayed but not eliminated.
Path to recovery. Lower real rates, acceptance of higher cap rates by sellers (recapitalization at lower valuations), sustained NOI growth, or a mix of all three is required for a normalization/recovery in the U.S. CRE market.
Risks to a recovery. Further increases in real rates; private-credit and CRE CLO stress; and regional-bank exposure (small and regional banks hold 67% of bank CRE loans).
Sources and Data Notes
- Trepp, CMBS Delinquency Report, September 2026; CMBS Special Servicing Report, September 2026.
- Trepp, Inside the $5.1T CRE Debt Universe, Q2 2026 (Federal Reserve Z.1, FFIEC Call Reports).
- Trepp, What Conduit CMBS Sources and Uses Reveal About the Refinancing Recovery, October 2026.
- Trepp, Where Is Multifamily Delinquency Concentrated?, October 15, 2026.
- MSCI, RCA CPPI US, August 2026 (published September 24, 2026).
- Newmark Research, 2Q26 U.S. Capital Markets Conditions & Trends.
- CBRE Investment Management, The Case For and Against Narrow Cap Rate Spreads, December 8, 2025.
- MMCG, Cap Rates and Interest Rates in U.S. Commercial Real Estate: A Data Note, updated March 26, 2026.
- Bloomberg series (as of October 21, 2026): national average cap rates by property type, USGG10YR and USGGT10Y, RCA CPPI, Moody's REIS.
- Historical delinquency peak: Commercial Observer, August 2012.
- Barclays, The SASB Scoop: Higher for longer, August 4, 2026.
- Barclays Research, SASB downgrade, realized loss and maturity performance data (Bloomberg, Trepp), October 23, 2026.
Notes. The "average cap rate" is the simple average of national apartment, Office, Industrial and Retail cap rates (hotel excluded). The real rate is the 10-year TIPS yield. Spreads use month-end values.
- Assumptions: 5-year hold, 3% annual NOI growth, 6.0% cap rate, new loan at 65% LTV / 1.25x DSCR at 6.5%.
- Trepp measures acquisition loan volume for the 15 largest loans in each conduit CMBS pool (May 2021–July 2026). The 2026 figure is the January–July volume annualized (×12/7), approximately $2.55 billion, 43.4% below 2022; Trepp notes it should not be read as a forecast. Total CRE investment sales rose 31% year over year in 1H26 (Newmark).
Want to discuss?
Reach out to the team for additional commentary or to be added to our distribution list.
Contact Us